May meant the end of our six-week trip through Portugal, Spain, and the Netherlands. And we cautiously tallied up our total expenses (see the itemized breakdown below). Through the smart use of rewards points and certificates, we cut our costs from about $15K to under $7K. That brought our 46 days of travel down to about $67/person/day!
We also continued our tradition of donating to one of three nonprofits, this time to an organization that helps teach swimming as a life skill. You can read more about them and vote for your favorite in the poll below!
We track our income, spending, and savings to stay on our FIRE path and share it with you. Keep reading to see our monthly updates, tips, and charity review.
Budget Update
If you’d like a more detailed description of our typical monthly cash flow (like our jobs or housing situation), check out our previous budget updates.
In the Sankey diagram below, the income on the left matches our expenses on the right.
We’ll run through the income and expense sources for the month and remark on any interesting items.
Income Summary
A bit like last month, much of our income shortfall was covered by our checking balance. As we only spent the first week of May traveling, we did have some earned income from short stints of part-time work. In fact, our savings is the underlying reason we had to pull from checking. Let’s have a look at some of the more interesting income-related categories.
Gifts Received
May is birthday month for both of us. Coincidentally, quite a few family members also have birthdays. As much as we try to insist grandparents and such needn’t mail gifts like this, they persist.
We received $300 in gifts.
Local Sales
Chris recently purchased a Dell monitor for about $200 which earned him both an AMEX credit offer and a $100 Dell gift card. He then used that gift card to buy yet another monitor—which earned another gift card—and yet another monitor with that gift card. He’s now sold all three monitors (two of them this past month). Each one has made a small profit to help reduce our underlying credit card annual fees.
We earned $330 in local sales.
Cashback
Jenni earned $45 as an Anthem health promo for improving her expected health outcomes—they have a bonus program for certain tasks. Our Laurel Road no-fee checking accounts continue to earn a $20 monthly bonus for making direct deposits of at least $2,500/month.
We earned $86 in cash back.
Credits
We’re back on the Gopuff bandwagon! Chase cardholders are eligible for statement credits with Gopuff ($10/month). Between the two of us, we can get back about $100 from Gopuff credits. That’s pretty great considering most of our Chase cards have no annual fee.
Jenni earned a credit for a free membership with Audible and Walmart+ (through statement credits) via her American Express card.
We received $104 in statement credits.
Expense Summary
From our $6,382 monthly budget, we saved and invested about $2,869.
That savings is nearly offset by the $1,461 we had to pull from checking to support our living expenses. Ultimately, we actually saved about $1,408.
After subtracting our credits, savings, and business expenses, we spent $3,405 on living expenses. That’s while traveling for the first week of the month, too!
That’s 80% of our FIRE budget from 2021 ($4,281/month).
Let’s break down some of the more exciting details.
Food & Dining
The tail-end of our trip, which occupied the first week of May, was in the Netherlands. We spent it mostly in Breda, which is a bit less expensive than well-known Amsterdam. Still, we stayed in hotels during this time. That meant lots of convenience foods which tend to be a little more costly.
Groceries
Groceries came in at about $589. That’s certainly more than the $272 we averaged from our 2021 FIRE Budget, but given inflation and that we were traveling—this seems pretty low!
Keeping yourself nourished with a mini-fridge and a microwave—if you’re lucky—isn’t cheap. But, we managed to mostly stick to healthier, fresher prepared foods like bean bowls, salads, and vegetable juice smoothies.
Our favorite word became korting when shopping for an easy dinner at the local grocery stores. In Dutch, that’s “discount”!
Restaurants & fast food
The vast majority of our food spending went to groceries in May. Part of that is keeping costs lower in the Netherlands where restaurants were expensive, but of course, we also had to do some restocking once we were home.
Being away for six weeks makes for a pretty barren fridge!
That said, we still had a handful of fun Dutch meals, coffee stops, and treats before we departed.

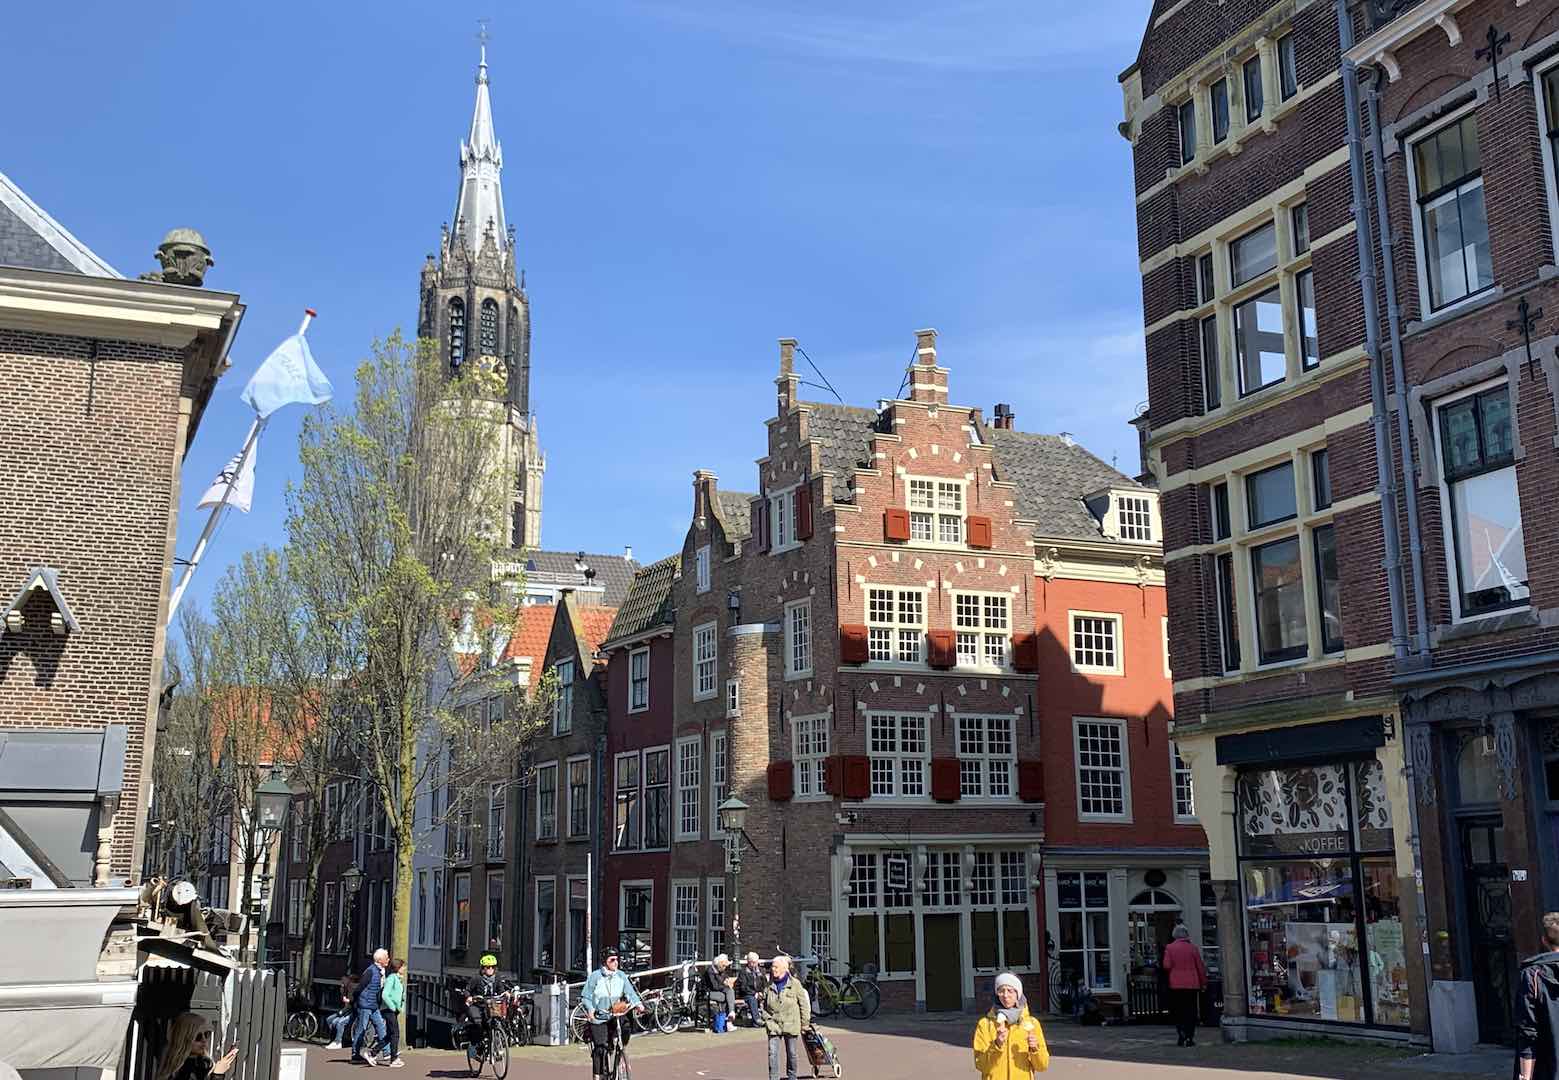

We spent $663 on food & dining this month.
Travel
Our travel expenses, compared to last month, shrunk to practically nothing. We stayed in hotels on points. Our flight back to the US was on miles—though there was still a fuel charge.
Hotel
Despite spending the first week of May in hotels, our out-of-pocket costs were about $44. We stayed in a very nice Marriott in Breda which was a renovated church.

They really went in on the whole saints and sinners theme with the hotel!
We burned through a large chunk of Marriott Bonvoy points for the stay but managed to take advantage of their program’s fifth-night free promotion. City taxes are what triggered that $44 expense. This hotel is normally about $200-250/night.
For our last night before our flight out of Schipol, we stayed in a Hyatt near the airport. Again, points covered the expense. It’s normally about $100-150/night.
Air travel
We flew back to the US from AMS to IAD with KLM Royal Dutch Airlines. They’re a pretty good flag carrier for the Netherlands. We booked the flight with miles which we transferred from Citi’s ThankYou points program, getting a bonus in the process.
Still, the fuel surcharges for the two direct tickets came to about $330.
Travel Summary
That concludes the third travel part of our six-week trip between Portugal, Spain, and the Netherlands. Our total Travel-specific costs came to $4,029.09 over the past three months. That just covers our typical travel categories (and not related expenses like public transit, restaurants, entertainment, and so on).
Check out the section in this post that tallies up our total trip costs.
We spent about $379 on travel this month.
Auto & Transport
Like last month, we made great use of the Netherlands’ amazing national railway. They’ve got a great system, and while it’s not cheap, it’s certainly efficient with great coverage.
We also still had a few Donkey Republic rental bike rides! We wrote a good bit about these bikes and the public transit systems in last month’s budget. Lastly, our trip finished with a ride on DC’s metro and then Amtrak home.
Public transport
We had no rental car while visiting the Netherlands and instead relied on the trains, our two feet, and a set of pedals. Between the trains, buses, and bikes—we spent about $180.

The balance, about $33, was spent on fueling up cars back home.
We spent about $213 on auto & transport this month.
Amusement
Get your tickets! Our amusement spending this month came from visiting a variety of Dutch cultural and historical sights. We took in a ton of sights and had some really great experiences.
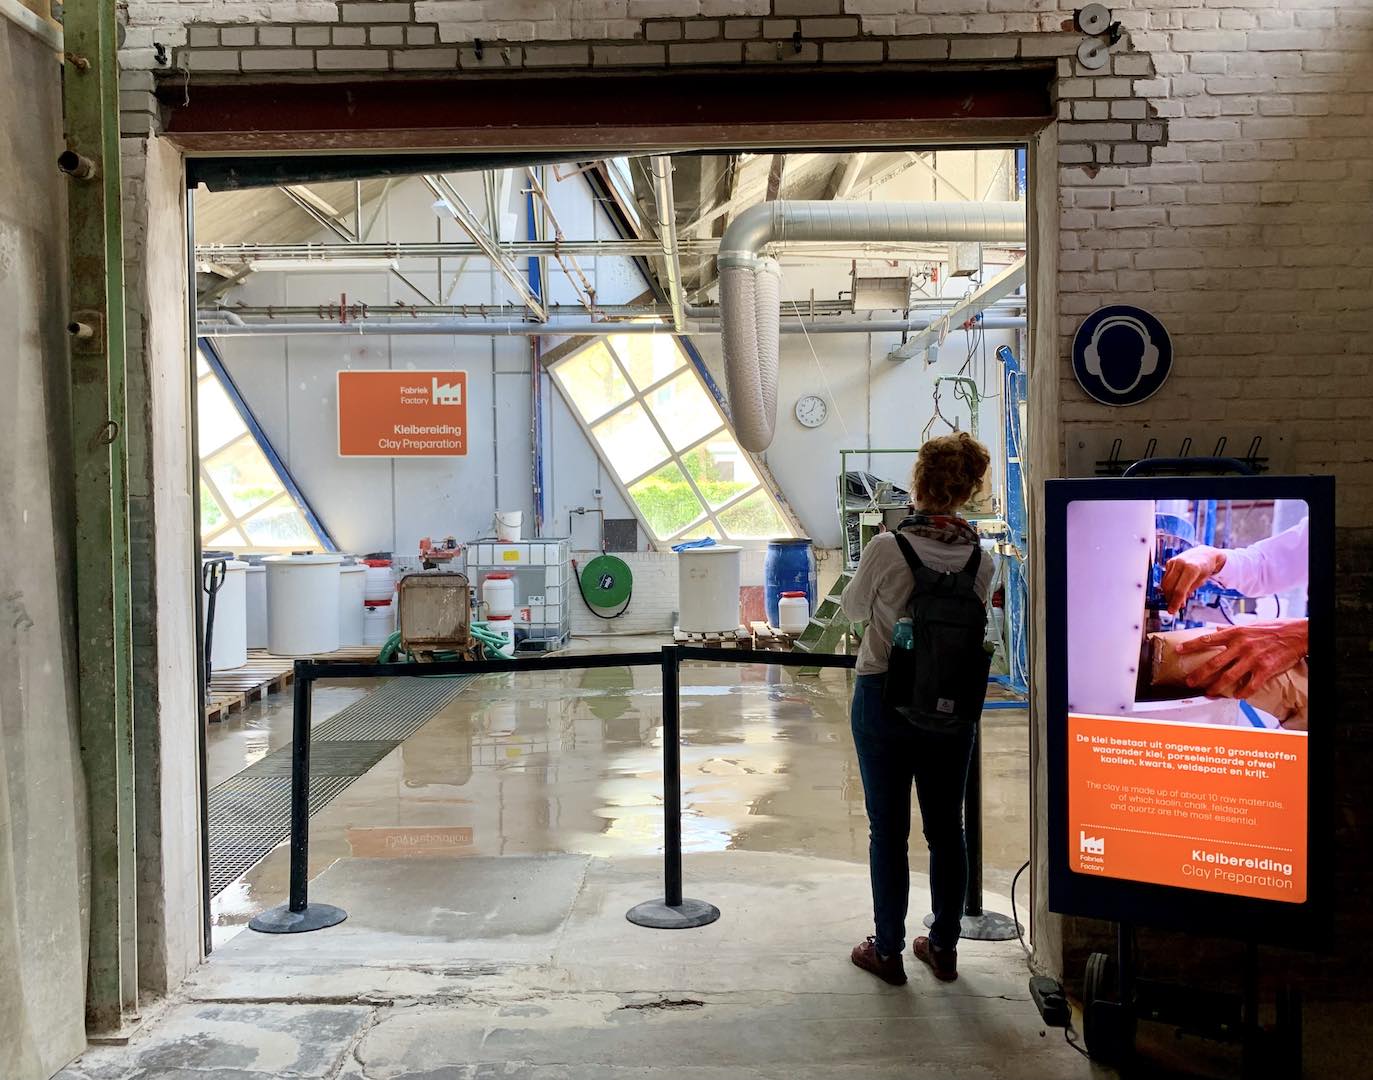
Our two big activities–
Of course, we did, and saw, much more than just that bullet list. But, this does represent our ticketed visits and tours.

We spent about $58 on amusement this month.
6-Week Travel Summary
Throughout the last three updates, we’ve been traveling throughout Europe. We started in March with a flight from JFK (which we missed!) to Madeira. The beautiful little Portuguese island was our banana-based home for about a week.
As April came round, we were on Tenerife island—part of Spain. While soaking in the warm sun in spring, we made the short flight to the mainland and explored southern Spain’s Andalusia region. By late April, hoping things had warmed up a bit, we flew to the Netherlands and began our Dutch adventure.
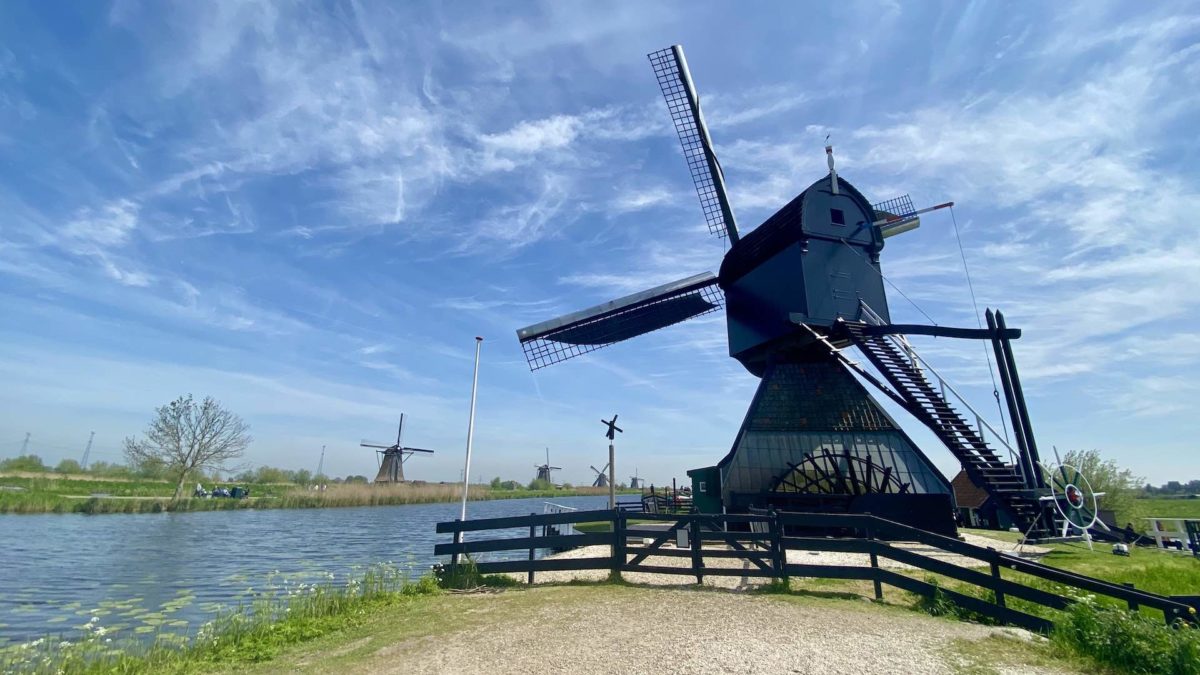
And of course, here in May, we closed the trip out with another week of taking in the countryside of southern Holland—windmills, stroopwafel, clogs, and all!
Trip cost table
Let’s take a look at our total trip cost. In the table below, you’ll find four columns:
- Description: a short summary of what the expense was for. We’ve included some basic geographical information for things like flights or hotels.
- Cost: our incurred expense in US dollars for the described line item. In some cases, this appears as zero. If a travel currency like hotel points, airline miles, or a credit card reward certificate covers the total expense, we record a zero here. In some cases, there’s a minor fee in addition to the use of points/miles for surcharges or taxes.
- Rewards Pts/Miles: we maximize our credit card rewards and frequent traveler currencies to cover the costs of our travel wherever possible. You’ll see a short description of the type of certificate or currency that we used.
- Estimated Value: when using a reward from the previous column to cover an expense, we record what we would have otherwise paid for the line item. This gives us a sense of our savings.
The table is generally in chronological order. For example, the first flights we took in March appear at the top. Hotel stays follow in order, along with our other flights. General categories, like groceries or amusement, appear after chronological flights and hotels.
We still incurred expenses at home (mortgage, utilities, etc.)—but these do not appear as part of our trip costs.
| Description | Cost (USD, $) | Rewards Pts/Miles | Est. Value (USD, $) |
|---|---|---|---|
| Flight—RIC→JFK | 0.00 | 13,094 AMEX Pts | 196.40 |
| Flight—JFK→FNC (Canceled) | 228.40 | ||
| Flight—JFK→FNC (2nd) | 46.80 | 72,000 United Miles | 2,082.00 |
| Hotel: 1 nt, Holiday Inn (JFK) | 0.00 | 1x IHG Certificate | 235.91 |
| Hotel: 4 nts, Ponta do Sol Airbnb (Madeira) | 262.94 | ||
| Hotel: 4 nts, Funchal Airbnb (Madeira) | 345.31 | ||
| Flight—FNC→TFN | 269.99 | ||
| Hotel: 3 nts, Los Realejos Airbnb (Tenerife) | 216.62 | ||
| Hotel: 2 nts, La Higuera Airbnb (Tenerife) | 168.69 | ||
| Hotel: 2 nts, San Marcos Airbnb (Tenerife) | 117.35 | ||
| Hotel: 5 nts, Playa las Americas Airbnb (Tenerife) | 398.51 | ||
| Flight—TFS→AGP | 83.02 | ||
| Hotel: 1 nt, Málaga centro | 75.75 | ||
| Hotel: 4 nts, Cortijo del Marqués (Granada) | 270.00 | 67,500 IHG Pts ($270→54,000 IHG Pts) | 660.00 |
| Hotel: 3 nts, Ronda centro Airbnb | 228.14 | ||
| Hotel: 1 nt, Málaga airport | 0.00 | 20,000 Hilton Pts | 157.33 |
| Flight—AGP→AMS | 20.64 | 12,000 Citi→Virgin Miles | 262.00 |
| Hotel: 2 nts, Schipol airport | 0.00 | 13,000 Hyatt Pts | 278.44 |
| Hotel: 2 nts, Amsterdam | 0.00 | 2x Marriott Certificates + 8,000 Pts | 754.37 |
| Hotel: 2 nts, Amsterdam | 0.00 | 2x Hyatt Certificates | 1,273.47 |
| Hotel: 2 nts, Utrecht | 0.00 | 59,750 Hilton Pts | 367.45 |
| Hotel: 5 nts, Breda | 43.65 | 93,000 Marriott Pts | 985.32 |
| Hotel: 1 nt, Schipol airport | 0.00 | 8,000 Hyatt Pts | 139.22 |
| Flight—AMS→IAD | 329.90 | 34,000 Citi→KLM Miles | 1,316.00 |
| Train—ALX→RIC | 20.00 | ||
| Car Rental: Madeira (Canceled) | 104.20 | ||
| Car Rental: Madeira (2nd) | 152.70 | ||
| Car Rental: Tenerife | 239.54 | ||
| Car Rental: Spain | 165.32 | ||
| Parking | 33.47 | ||
| Gas & Fuel: rental cars | 174.81 | ||
| Public Transit: train, bus, bike, cable car | 460.40 | ||
| Taxis & Uber | 5.00 | ||
| Dining: restaurants, fast food, coffee shops | 625.91 | ||
| Alcohol & Bars | 43.62 | ||
| Groceries | 609.58 | ||
| Souvenirs | 32.14 | ||
| Amusement: tickets, tours, entry fees | 386.71 | ||
| Mobile phone: eSIMs | 24.00 | ||
| Total | 6,183.11 | 346,344 Points/Miles 5x Hotel Certificates | 8,707.91 |
Trip expense discussion
From the trip cost table above, we spent about $6,183 out of pocket.
We traveled from the US to Madeira (Portugal), onto Tenerife (Spain), to Andalusia (Spain’s mainland), and up to the Netherlands before returning back home to the US.
We spent this over 46 days. So, we averaged $67 per person, per day.
Our hotel and Airbnb changed 17 times.
We took a total of 6 flights (and paid for 7!).
Between trains, buses, cable cars, water taxis, and bikes—we had dozens of public transit rides.
Had we not used 346,344 rewards points (airline miles, credit card points, hotel points) and five hotel night certificates, the same trip would have cost $14,891.
That’s a massive savings from a smart use of these currencies!
Still, the reality is that we wouldn’t have stayed in the same places or taken the same flights had we not been using rewards points/certificates. There’s no reality where we would have actually stayed at the Hyatt Regency in Amsterdam on King’s Day for $637 per night.
Yes, rates were very high for the festivities and the Regency is a beautiful, high-end hotel. But, we would have stayed further outside of Amsterdam to try to keep the price closer to $200 or so had we been paying the cash rate.
Similarly, using United miles to book a pair of same-day one-way flights to Madeira saved us over $2K when we missed our original flight. But, without the miles, we would have likely waited another 24 hours and taken a flight that was about half the price with significantly longer travel time.
That can throw off the actual value of these rewards, but it’s useful to see what the same trip would have cost us without them.
Ultimately, rewards cut our trip cost by a whopping 58%!
How Much We Work
We like to keep track of how much time we spend doing work that is paid.
Let’s add this month to the list…
| Month | Chris (Hours Worked) | Jenni (Hours Worked) |
|---|---|---|
| May 2020 | 41 | 108 |
| Jun 2020 | 38 | 96 |
| Jul 2020 | 36 | 120 |
| Aug 2020 | 39 | 48 |
| Sep 2020 | 27 | 76 |
| Oct 2020 | 26 | 104 |
| Nov 2020 | 27 | 57 |
| Dec 2020 | 28 | 57 |
| Jan 2021 | 25 | 102 |
| Feb 2021 | 24 | 104 |
| Mar 2021 | 24 | 106 |
| Apr 2021 | 23 | 85 |
| May 2021 | 17 | 29.75 |
| Jun 2021 | 19 | 66 |
| Jul 2021 | 21 | 30.25 |
| Aug 2021 | 23 | 16.5 |
| Sep 2021 | 26 | 28 |
| Oct 2021 | 22 | 49 |
| Nov 2021 | 21 | 51 |
| Dec 2021 | 64 | 27 |
| Jan 2022 | 32 | 80 |
| Feb 2022 | 29 | 63 |
| Mar 2022 | 14 | 70 |
| Apr 2022 | 15 | 21 |
| May 2022 | 14 | 36 |
| Jun 2022 | 6 | 12 |
| Jul 2022 | 13 | 45.5 |
| Aug 2022 | 15 | 96 |
| Sep 2022 | 12 | 54 |
| Oct 2022 | 14 | 34.5 |
| Nov 2022 | 12 | 72 |
| Dec 2022 | 11 | 16.5 |
| Jan 2023 | 10 | 88 |
| Feb 2023 | 11 | 81.5 |
| Mar 2023 | 12 | 47.5 |
| Apr 2023 | 8 | 1 |
| May 2023 | 16 | 100 |
Both of our workloads dropped while traveling, but we’ve been making up for it more recently.
Net Worth Update
Net worth is not our primary measurement and can understand it can be discouraging if you’re working yourself out of debt. We also understand it’s difficult to be transparent with our readers without divulging this information so we continue to do so.
Account breakdown
The market keeps chugging along and so do our investments. From a high level, our assets and liabilities are shown in the data table below as of May 31, 2023.
| Description | Value (USD, $) |
|---|---|
| 401(k) | 740,719 |
| Brokerage | 723,830 |
| Roth IRA | 139,752 |
| Traditional IRA | 12,980 |
| HSA | 54,791 |
| Real Estate | 393,900 |
| Mortgage | (141,973) |
| Miscellaneous Assets | 56,642 |
| Checking & Savings | 14,605 |
| Net Worth | 1,995,247 |
- Miscellaneous assets include specific investments we’ve made in physical assets (think collectibles) and treasury bonds
- Amounts do not reflect the value of the businesses Chris owns or their assets, which should appear as income to us over future years
- Jenni’s Prius is not included
The S&P 500 was up about 0.25% for the month.
We gained a good bit more, despite our travels, with an increase of 0.7%.
Overall, our net worth increased by around $13K.
Net Worth History
| Date | Amount | % Change |
|---|---|---|
| July 2020 | $1,555,289 | – |
| August 2020 | $1,597,334 | 2.7% |
| September 2020 | $1,566,393 | (2.0%) |
| October 2020 | $1,568,182 | 0.01% |
| November 2020 | $1,720,113 | 9.6% |
| December 2020 | $1,810,864 | 5.3% |
| January 2021 | $1,860,996 | 2.8% |
| February 2021 | $1,878,154 | 0.9% |
| March 2021 | $1,918,269 | 2.1% |
| April 2021 | $2,010,849 | 4.8% |
| May 2021 | $2,049,213 | 1.9% |
| June 2021 | $2,093,896 | 2.2% |
| July 2021 | $2,092,153 | (0.1%) |
| August 2021 | $2,130,761 | 1.8% |
| September 2021 | $2,070,730 | (2.8%) |
| October 2021 | $2,151,272 | 3.9% |
| November 2021 | $2,095,273 | (2.6%) |
| December 2021 | $2,160,235 | 3.1% |
| January 2022 | $2,055,292 | (4.9%) |
| February 2022 | $2,058,001 | 0.01% |
| March 2022 | $2,134,428 | 3.7% |
| April 2022 | $1,968,069 | (7.8%) |
| May 2022 | $1,975,569 | 0.04% |
| June 2022 | $1,868,397 | (5.4%) |
| July 2022 | $1,975,608 | 5.7% |
| August 2022 | $1,878,352 | (5.2%) |
| September 2022 | $1,735,997 | (7.6%) |
| October 2022 | $1,820,287 | 4.9% |
| November 2022 | $1,920,635 | 5.5% |
| December 2022 | $1,866,513 | (2.8%) |
| January 2023 | $1,953,691 | 4.7% |
| February 2023 | $1,882,656 | (3.6%) |
| March 2023 | $1,969,566 | 4.6% |
| April 2023 | $1,981,934 | 0.6% |
| May 2023 | $1,995,247 | 0.7% |
Previous Donation Winner
In last month’s poll, we focused on charities helping kids get the chance to go to summer camp without financial barriers. The winner with ten votes is Children’s Life-Saving Foundation. This organization provides free outdoor educational summer camps, teen surf camps, and counselor programs, annual holiday Project Angel Wings to vulnerable families in California.
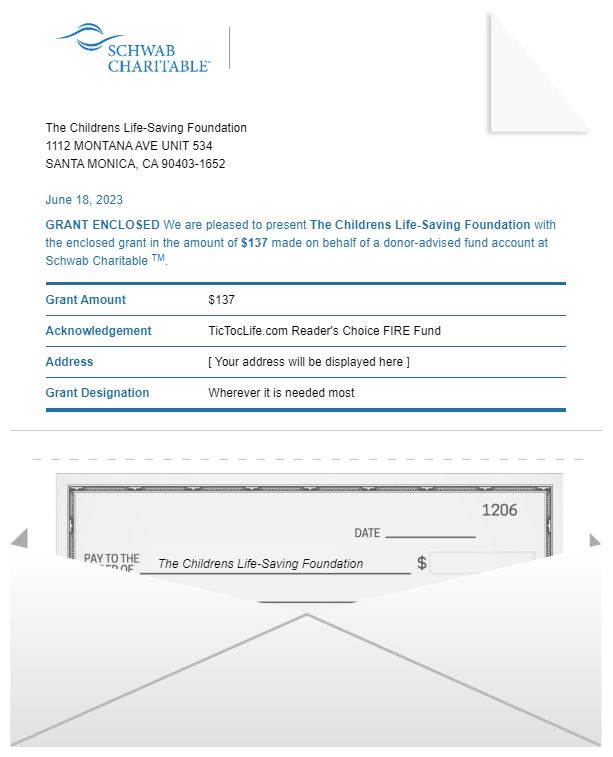
Our Reader’s Fund seeks to leverage the principles of FIRE to build a lifetime of giving.
Thank you for your participation in our polls over the last 34 months. We’ve given over $4,000 to deserving charities with your help in deciding which organizations to donate to.
Polls are now open for our next round of candidates: Water Safety Charities.
Charity Round-Up
This month we are diving into the topic of water safety and swimming for our summertime theme for our charity poll. Swimming is a great summertime activity but can be dangerous. Did you know drowning is the third leading cause of unintentional death worldwide, and that more than half the world’s population can not swim?
That’s why we want to highlight three charities that are working to prevent drowning and promote swimming skills to make summertime more safe and fun for everyone. Review these three organizations that help teach people to swim and save lives. Each organization has excellent charity ratings which will ensure our donation will have the greatest impact. Review each one and help us decide which organization to support by casting your vote.
Summaries below include the impact metrics and a link to their Guidestar profile which details the nonprofit’s operations and transparency.
1) USA Swimming Foundation
Why? A month of formal swimming lessons could reduce the risk of childhood drowning by 88%. Swimming lessons can cost as little as $50!
Where? The United States
Our Notes: USA Swimming Foundation is a non-profit organization that saves lives through swimming for both children and adults. They help safely expand the aquatic world to those who may not have otherwise participated because they didn’t know how to swim. The program is funded by grants which can be used to cover the costs of lessons, as well as, any necessary transportation.
2) Greater Richmond Aquatics Partnership (GRAP)
Why? GRAP provides free swim lessons to underserved youth and they support seniors and people with disabilities to stay active and healthy through waterobics.
Where? Central Virginia
Our Notes: The Greater Richmond Aquatics Partnership (GRAP) is a nonprofit organization that operates SwimRVA, an aquatics facility for water safety, health and fitness, and sports tourism. They hope to break the barrier of access to swimming and provide lifelong aquatic opportunities.
3) No More Under
Why? We need more awareness and education about water safety to prevent nearly 1000 children from dying each year. 64% of black children, 45% of Hispanic children, and 40% of Caucasian children have little to no ability to swim. Water safety and swimming lessons need to be prioritized for all youth regardless of income or race.
Where? Tukwila, Washington
Our Notes: No More Under is a black-led non-profit organization that improves water safety by providing free swim lessons and life jackets to those who need them. They are expanding their life jacket loaner stations, which encourage free access to life jackets, at five public beaches this year. They partner with organizations that offer swim instructions and cover the expenses for the participants, eliminating any financial barriers.
Nonprofit poll
After reviewing the list above, please take a moment to vote for which nonprofit you think will put funds to use in the best way.
(Have trouble using or seeing the poll above? Some reader tools or apps may not display it. View this page in a browser or use this link to our Reader Fund page which has a copy of the poll!)
Thank you for taking the time to vote!
One of our primary goals with TicTocLife is building a stream of giving within the FIRE community and that starts with knowledge.
Want to hear about the results? Signup for our free FIRE Insider newsletter! We send it out every few weeks and include the monthly poll results and donation winners. You can see an archive of the FIRE Insider and signup here!
What’s Next
It’s pretty wild how we spent 46 days traveling Europe, and thoroughly enjoying it, on less than $7K. Those reward points, selective use of Airbnbs, and generally trying to live life like we would at home — really all make a difference!
With our big spring trip settled and in the rearview mirror, we’re taking a break. June has been a time to catch up on chores, maintenance, and our social lives. We’ve had lots of friend time and have more scheduled for summer.
We live in a pretty amazing place, so we’ll be taking advantage of all that summer brings to our adventurous little corner. It’s hard to beat the warm sun, a winding river, and a rocky hike with friends!
July will have us taking a small trip to the beach with family for about a week. No doubt we’ll be planning more adventures in the fall, but we’re taking it easy for now. FIRE lets us have a slow return to our life at home and an even slower time soaking in the pleasure such freedom brings.
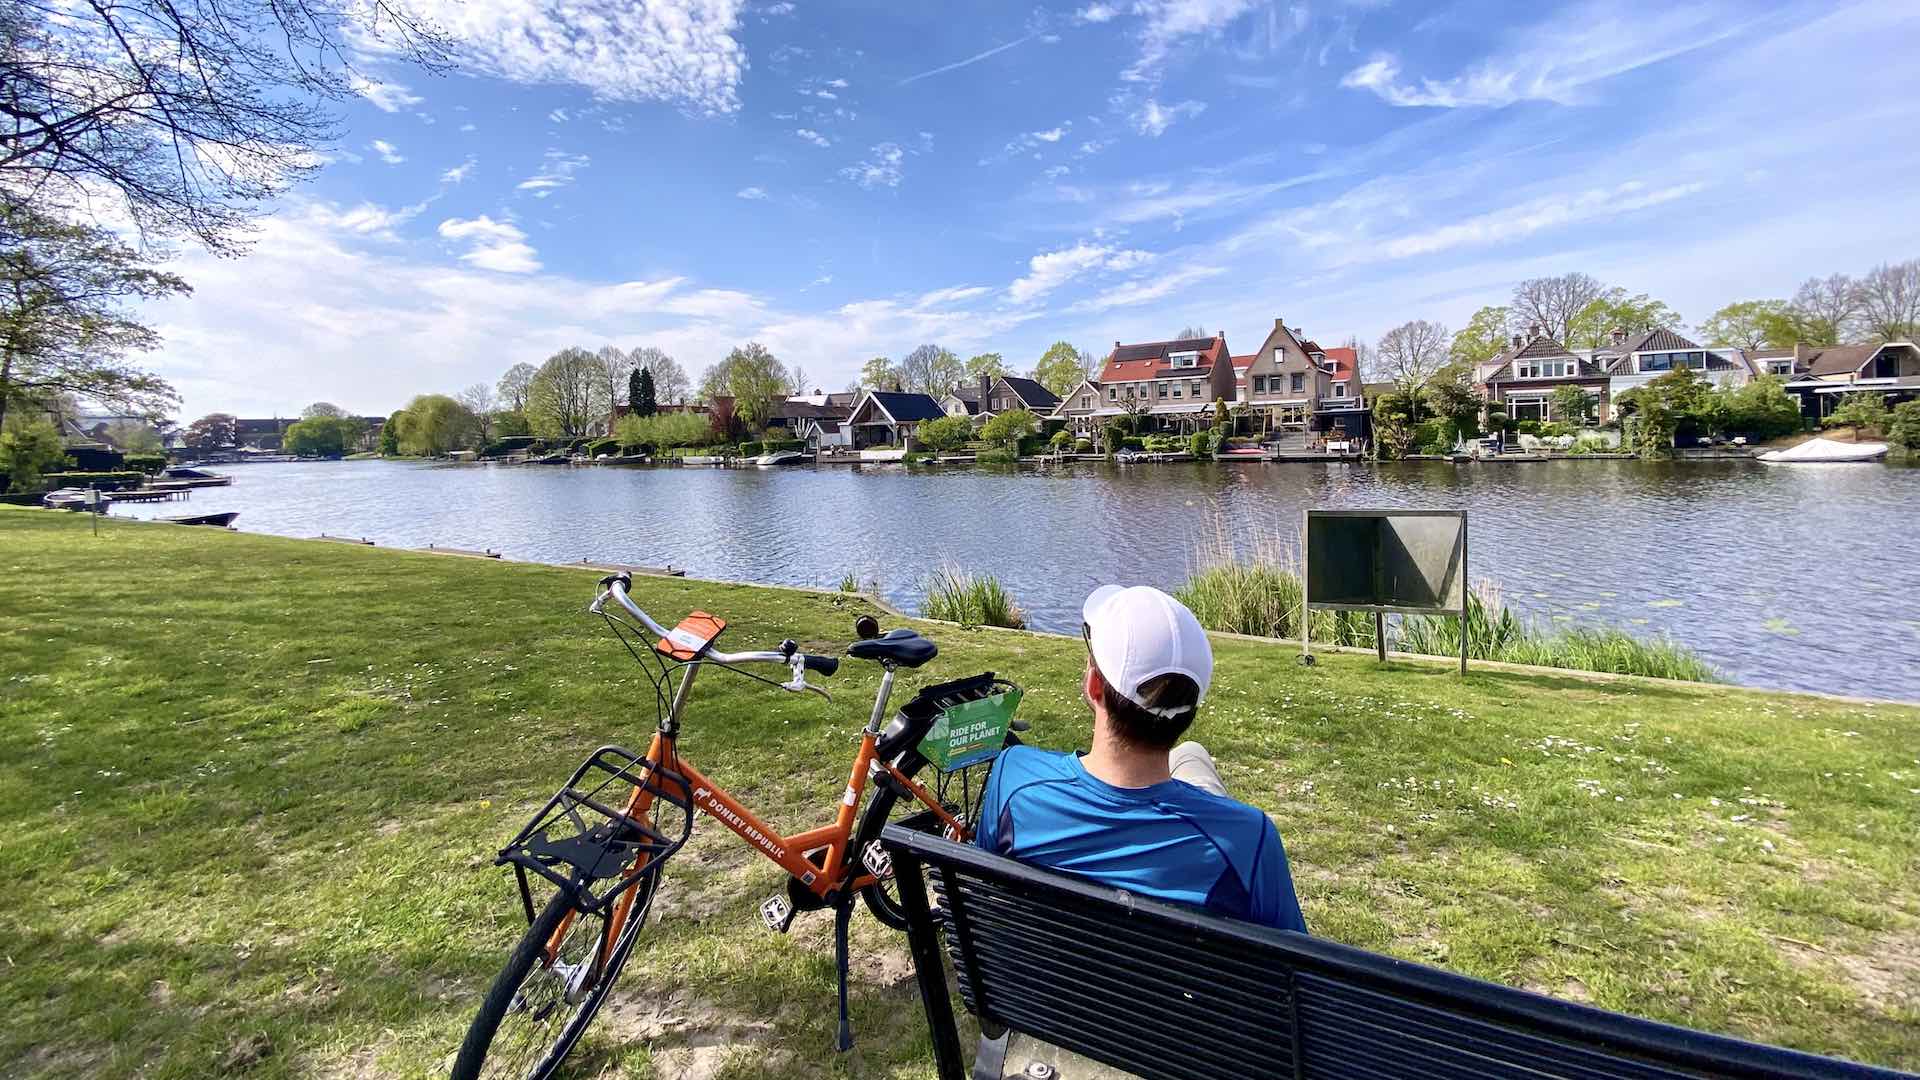
Got any big summer trips lined up?
Let us know in the comments or on Twitter!

2 replies on “How We Spent 46 Days in Europe for <$7K (May 2023 Update)”
Love that trip cost table! Thanks for the wonderful breakdown!
I’m surprised by how cheap the lodging was in general (excluding the ones in Amsterdam, Utrecht, Breda).
How did you score those 5x Hotel Certificates? What are the points equivalent of each of those certs?
Hey TK!
Four of the certificates came from credit cards, and one from a special use award:
Those annual fee costs are accounted for in our monthly budgets as hotel expenses for the most part. But, they’re not figured into the table—which they probably should be. Each certificate has points limits (like 35K for the Bonvoy cards) or category limits, though I don’t recall them offhand. For the most part, we tried to maximize. That’s how we got such great value out of the Hyatt certificates.
And yeah, the Airbnb rates in Madeira and Tenerife were very surprising to us. We know Portugal and Spain don’t tend to be very expensive, but these are each fairly popular tourist islands. We expected a lot more. Plus, we stayed in some incredible places!